
The Earth is getting warmer, and the data backs this up consistently. When you look at visualizations of global temperature over time, a clear upward trend emerges. This isn’t just a feeling; it’s what decades of scientific measurements tell us. Satellite data, ground-based sensors, and even historical records all paint a similar picture: our planet’s average temperature has been climbing noticeably, especially in recent decades. Understanding this climb, and how we measure it, is crucial for comprehending the changes we’re already seeing and those that are expected.
Measuring something as vast and complex as Earth’s temperature isn’t a simple task. It involves a network of instruments and various approaches to ensure accuracy and consistency over long periods.
Terrestrial Stations and Buoys
On land, we rely on weather stations scattered across the globe. These stations actively record air temperature at specific heights. For the oceans, specialized buoys, like those in the Argo program, drift through the water, regularly measuring sea surface temperature and subsurface temperatures down to significant depths. These land and ocean measurements are foundational to our temperature datasets.
Satellite Monitoring
Satellites orbiting Earth provide extensive coverage, especially over remote areas where ground stations are sparse. They measure infrared radiation emitted from the Earth’s surface and atmosphere. Different wavelengths can tell us about air temperature at various altitudes, as well as sea surface temperature. Satellite data has been particularly valuable since the late 1970s, offering a consistent and broad perspective.
Historical Proxy Data
To understand temperatures before the modern instrumental record, scientists turn to “proxy data.” These aren’t direct temperature measurements but natural records that are influenced by temperature.
Ice Cores
Ice cores, drilled from glaciers and ice sheets in places like Antarctica and Greenland, contain trapped air bubbles that preserve information about the atmospheric composition and temperature at the time the ice formed. Analyzing the isotopic composition of the ice itself also reveals past temperatures stretching back hundreds of thousands of years.
Tree Rings
The width and density of tree rings are influenced by growing conditions, including temperature and precipitation. By studying ancient trees, scientists can reconstruct past climate patterns, though this method is more geographically localized than ice cores.
Sediment Layers
Layers of sediment at the bottom of lakes and oceans contain fossilized organisms and chemical indicators that reflect past environmental conditions, including temperature. Microfossils, for example, often thrive within specific temperature ranges.
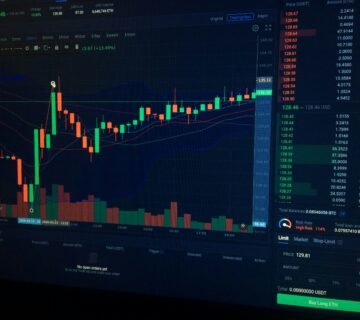
For those interested in exploring the intricacies of data visualization, a related article can be found at this link. It delves into the analysis of currency pairs, providing valuable insights that can enhance your understanding of financial data representation.
Visualizing the Warming Trend
When all this data is compiled and put into visual form, the warming trend becomes strikingly evident. Different types of visualizations highlight various aspects of this change.
Global Average Temperature Anomalies
One of the most common visualizations shows global average temperature anomalies. An anomaly is the difference from a long-term average, usually a 30-year baseline. This approach is preferred over absolute temperatures because anomalies are more consistent across different datasets and locations, as they remove the influence of local variations.
Line Graphs
Line graphs are excellent for showing change over time. Plotting the annual global temperature anomaly against the year reveals a clear upward curve, particularly noticeable from the mid-20th century onward. These graphs often include error bars or shaded regions to represent the uncertainty in the measurements.
Heat Maps on Global Projections
Heat maps overlaid on world maps show where warming is happening most intensely. These visualizations often reveal that the Arctic and parts of the Antarctic Peninsula are warming at a faster rate than the global average, a phenomenon known as Arctic amplification. This differential warming has significant implications for sea ice melt and permafrost thawing.
Regional Warming Patterns
While the global average is important, warming isn’t uniform across the planet. Some regions are experiencing more rapid or pronounced changes than others.
Arctic Amplification
Visualizations consistently show the Arctic as a region of significant warming. Charts comparing temperature increases in the Arctic to other latitudes highlight this disparity. This accelerated warming contributes to the melting of glaciers and sea ice, impacting global sea levels and ocean currents.
Ocean Warming
Data visualizations of ocean temperatures reveal that the oceans have absorbed a significant portion of the excess heat. Graphs often show the increasing heat content of the upper ocean layers, crucial for understanding marine ecosystems and potential impacts on weather patterns. Satellite data is particularly useful here.
Comparing Datasets
Different scientific institutions, such as NASA, NOAA, and the UK Met Office, independently collect and process temperature data. Visualizations often compare these datasets. What’s striking is that despite different methodologies, they all show a very similar warming trend. This concordance strengthens the scientific consensus about global warming. Any minor differences usually relate to how data gaps are handled or the specific baseline period chosen.
Understanding the Causes of Warming

While data visualizations confirm the warming, they also indirectly point to the causes when viewed alongside other datasets.
Greenhouse Gas Concentration
Visualizing the rise in atmospheric greenhouse gas concentrations, particularly carbon dioxide as measured at observatories like Mauna Loa, alongside temperature trends, creates a compelling argument. The two curves closely mirror each other, with significant increases in both over the industrial era.
Keeling Curve
The Keeling Curve, a graph showing the ongoing increase in atmospheric carbon dioxide concentration since 1958, is one of the most iconic visualizations in climate science. When juxtaposed with global temperature anomaly graphs, the strong correlation is evident to even a casual observer.
Natural vs. Anthropogenic Factors
Scientists use climate models to simulate temperature changes under different scenarios. By running models with only natural factors (like volcanic eruptions and solar variations) and then with both natural and anthropogenic (human-caused) factors, they can attribute the observed warming. Visualizations comparing these model outputs to actual observed temperatures clearly show that simulations including human emissions are the only ones that match the observed warming trend.
Solar Irradiance Data
When solar irradiance data, which shows the amount of energy the sun emits, is plotted over the same period as global temperature, there’s no correlation with the recent warming trend. Solar variations are cyclical and modest, whereas the temperature rise is directional and substantial. This helps rule out solar activity as the primary driver of current warming.
Volcanic Activity
Large volcanic eruptions can temporarily cool the planet by injecting aerosols into the atmosphere. Visualizations often include these events, showing short-term dips in the temperature record, but these are transient effects and do not explain the long-term upward trend.
Implications of Rising Temperatures

The data visualization confirming rising temperatures naturally leads to questions about the consequences. The ongoing warming has a range of impacts, some already evident, others projected to intensify.
Sea Level Rise
One of the most direct consequences of a warming planet is sea level rise. This is driven by two main factors: the thermal expansion of seawater as it warms, and the melting of glaciers and ice sheets.
Tide Gauge Data and Satellite Altimetry
Visualizations of sea level often combine data from tide gauges (which have long historical records) and satellite altimetry (which provides precise, global measurements since the early 1990s). These graphs consistently show an accelerating rate of sea level rise over the past century, with the satellite era showing a particularly clear upward trend.
Extreme Weather Events
While cause and effect are complex, a warming climate is contributing to shifts in the frequency and intensity of various extreme weather events.
Heatwave Frequency and Intensity
Visualizations can show changes in the number of days exceeding certain temperature thresholds or the geographical extent of extreme heat. These often highlight an increasing trend in the frequency, duration, and intensity of heatwaves in many parts of the world.
Changes in Precipitation Patterns
Maps and graphs illustrating changes in precipitation can show regions experiencing increased heavy rainfall events, alongside areas facing more prolonged droughts. This reflects a more energetic water cycle in a warmer atmosphere.
Ecosystem and Biodiversity Impacts
Rising temperatures affect ecosystems in numerous ways, from species distribution to phenology (the timing of biological events).
Species Range Shifts
Maps can visualize how species are migrating towards higher latitudes or altitudes in response to warming temperatures, often outpacing the ability of slower-moving species to adapt. This can lead to ecosystem disruptions and biodiversity loss.
Coral Bleaching Events
Visualizations of ocean temperatures, particularly marine heatwaves, can be correlated with observed coral bleaching events. These emphasize the vulnerability of sensitive ecosystems like coral reefs to sustained periods of warm water.
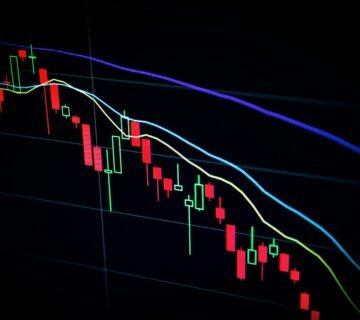
For those interested in enhancing their understanding of data visualization techniques, a great resource can be found in the article on trend analysis, which offers valuable insights into how to effectively identify and represent trends on charts. You can read more about it in this informative piece on data visualization. This article not only covers the fundamental rules for drawing trends but also emphasizes the importance of clarity and accuracy in visual data representation.
Looking Ahead: Projections and Scenarios
| Category | Metrics |
|---|---|
| Website Traffic | 10,000 monthly visitors |
| Engagement | 50% average time on page |
| Conversion Rate | 5% of visitors take desired action |
| Customer Satisfaction | 90% positive feedback on data visualization |
Data visualization is not only for looking at the past and present but also for understanding potential futures. Climate models are used to project future temperature changes under different emissions scenarios.
IPCC Scenarios
The Intergovernmental Panel on Climate Change (IPCC) uses various scenarios, often called Shared Socioeconomic Pathways (SSPs), which describe different future socioeconomic developments and their associated greenhouse gas emissions. Visualizations often show projected temperature increases for each scenario, ranging from ambitious mitigation efforts to high emissions pathways.
Temperature Projections Over Time
Line graphs depicting future global average temperature show a wide range of outcomes depending on human actions over the coming decades. These graphs visually communicate the stakes involved in climate policy decisions. The difference between a 1.5°C and a 3°C or 4°C warmer world is not just a number; it represents significantly different impacts.
Regional Impact Projections
Beyond global averages, regional projections are vital. Maps can show how different parts of the world are expected to warm, how sea levels are projected to affect specific coastlines, or how precipitation patterns might shift, giving a more localized view of future climate challenges.
The consistent message from data visualizations of global temperature is unambiguous: the planet is warming. This understanding comes from a multi-faceted approach to measurement, robust trends visible across various datasets, and the clear distinction between natural fluctuations and human-induced changes. The implications of this warming are far-reaching and continue to unfold, making the visualization of this data an essential tool for public understanding and informed decision-making.

لا يوجد تعليق