Data visualization is the process of translating raw data into visual representations like charts, graphs, and maps. This makes complex information easier to understand and reveal patterns, trends, and outliers that might otherwise go unnoticed.
The Foundation: Why See Your Data?
Imagine trying to understand a massive spreadsheet filled with numbers. It’s overwhelming, right? Data visualization is like switching from that overwhelming spreadsheet to a clear, informative picture. It’s not just about making things look pretty; it’s about making information accessible and actionable for everyone, regardless of their technical background.
Beyond the Numbers
Our brains are wired to process visual information far more effectively than rows and columns of text. Think about it: a good map helps you navigate a new city much faster than reading street addresses. Data visualization does the same for your data, allowing you to grasp key insights at a glance.
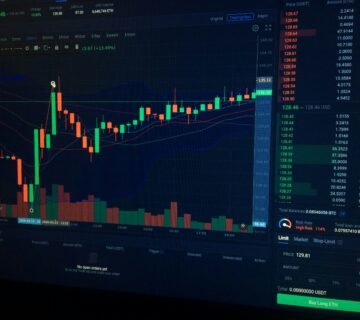
For those interested in exploring the intricacies of data visualization, a related article that delves into the analysis of currency pairs, specifically the dollar index, can be found at this link. This article provides valuable insights into how visual data representation can enhance understanding of market trends and currency fluctuations.
Unpacking Complex Datasets
The sheer volume of data we generate today is staggering. Whether it’s customer behavior, financial transactions, or scientific research, these datasets can be incredibly intricate. Without proper tools to explore them, valuable information can remain hidden.
Identifying Trends Over Time
Visualizing data over a period allows us to see how things change. Are sales increasing or decreasing? Is customer engagement improving? A line chart can immediately tell this story, showing the upward or downward trajectory in a way a table of monthly totals simply can’t.
Seasonal Fluctuations and Growth Patterns
Spotting seasonal trends, like a spike in retail sales during holidays, becomes obvious when visualized. You can also discern long-term growth or decline, helping you plan for the future and adjust strategies.
Predicting Future Behavior
By understanding historical patterns through visualization, we can take educated guesses about what might happen next. This isn’t fortune-telling, but rather informed forecasting based on observable trends.
Spotting Outliers and Anomalies
Sometimes, the most interesting pieces of data are the ones that don’t fit the norm. These outliers can represent unique opportunities or critical issues that need attention.
Fraud Detection and Error Identification
In finance, unusual spikes or dips in transaction volumes can signal fraudulent activity or system errors. Visualizing this data helps these anomalies stand out, prompting immediate investigation.
Performance Benchmarks and Deviations
In business, identifying which products or regions are performing exceptionally well or poorly is crucial. A scatter plot or bar chart can quickly highlight these outliers against average performance.
Enhancing Decision-Making Processes
Good decisions are built on good information. Data visualization transforms raw data into a format that fuels smarter, faster, and more confident decision-making.
Communicating Insights Effectively
Trying to explain a complex finding to someone without the right tools can be challenging. A well-crafted chart or graph can convey the same information in seconds, facilitating clearer communication across teams and departments.
Storytelling with Data
Visualization allows you to weave a narrative from your data. You can show the progression of a project, the impact of a marketing campaign, or the evolution of a customer segment. This makes the insights more compelling and memorable.
Facilitating Collaboration
When everyone can see and understand the same data representation, it fosters better collaboration. Teams can discuss findings, brainstorm solutions, and align on strategies based on a shared, visual understanding.
Revealing Hidden Patterns and Relationships
Sometimes, the most significant insights aren’t about individual data points but about how different pieces of information connect.
Correlation vs. Causation
Visualization can help us see potential correlations between different variables. For example, does increased website traffic correlate with higher sales? While correlation doesn’t always mean causation, it’s a strong starting point for further investigation.
Customer Segmentation and Behavior Analysis
By visualizing customer purchase history, demographics, and interaction data, businesses can identify distinct customer segments and understand their unique behaviors and preferences. This allows for more targeted marketing and product development.
Choosing the Right Visualization Tool
The world of data visualization tools is vast, ranging from simple spreadsheet features to sophisticated business intelligence platforms. The key is to select a tool that fits your needs and skill level.
Understanding Your Data and Audience
Before picking a tool, consider what kind of data you have and who you’ll be sharing the results with. Are you analyzing a few dozen data points, or millions? Will your audience be technical experts or general stakeholders?
Common Visualization Types and Their Uses
- Bar Charts: Great for comparing discrete categories. Think comparing sales figures for different products.
- Line Charts: Ideal for showing trends over time. The classic example is tracking stock prices or website visitors daily.
- Scatter Plots: Useful for identifying relationships between two numerical variables. See if there’s a link between advertising spend and revenue.
- Pie Charts: Best for showing parts of a whole, but use with caution as they can become cluttered with too many slices. Good for visualizing budget allocation.
- Histograms: Show the distribution of a single numerical variable. Understand the range and frequency of ages in your customer base.
- Maps: Excellent for displaying geographical data. Visualize sales performance by region or population density.
Practical Tools for Every Need
- Spreadsheet Software (Excel, Google Sheets): For basic charts and analysis, these are often already available and easy to use.
- Business Intelligence (BI) Platforms (Tableau, Power BI, QlikView): These offer more advanced features for interactive dashboards, data exploration, and enterprise-level reporting. They allow for complex data blending and creation of dynamic visualizations.
- Programming Libraries (Matplotlib, Seaborn in Python; ggplot2 in R): For data scientists and analysts who need maximum flexibility and customizability, these libraries offer powerful coding-based visualization capabilities.
Data visualization plays a crucial role in interpreting complex data sets, making it easier for stakeholders to understand trends and insights. For those interested in exploring how data visualization can enhance decision-making in various industries, a related article discusses the impact of Chinese cars on the economy and how visual data representation can clarify this relationship. You can read more about it in this insightful piece on the subject by following this link: here.
The Iterative Process of Exploration
Data visualization isn’t a one-and-done activity. It’s often an ongoing journey of exploration, refinement, and discovery.
From Raw Data to Meaningful Insights
The initial visualizations might spark new questions. You might notice a strange pattern that requires deeper digging. This iterative process is where true understanding emerges.
Refining Your Visuals
As you learn more, you might realize an initial chart isn’t the most effective way to communicate your findings. You might need to adjust the chart type, add more detail, or simplify the representation.
Focusing on Clarity and Impact
The goal is always to make the data easy to understand and to highlight the most important takeaways. Overly complex or poorly designed visualizations can obscure rather than illuminate.
Avoiding Misinterpretation
It’s crucial to ensure your visualizations accurately represent the data and don’t lead to incorrect conclusions. This involves careful labeling, appropriate scales, and a clear understanding of the data’s limitations.
Beyond Business: Applications Across Fields
The power of data visualization extends far beyond the corporate world. It’s an indispensable tool for researchers, educators, journalists, and anyone looking to understand the world around them.
Scientific Discovery and Research
Scientists use visualization to analyze complex experimental results, identify patterns in genetic data, or map the spread of diseases. It helps them communicate their findings to colleagues and the public.
Journalism and Public Understanding
News organizations increasingly use data visualization to present complex societal issues, election results, or economic data in a digestible way for a broad audience. This makes reporting more engaging and informative.
Education and Learning
Visualizations can make abstract concepts more concrete for students. Whether it’s understanding historical timelines, geological processes, or mathematical principles, visual aids significantly enhance learning.
Personal Finance and Health Tracking
Individuals can use visualizations to track their spending habits, monitor their fitness goals, or understand their health metrics. This personal application empowers them to make informed choices about their lives.
In essence, data visualization is about making the invisible visible, transforming abstract numbers into tangible insights that drive understanding and action. It’s a skill that’s becoming increasingly vital in our data-rich world.


لا يوجد تعليق